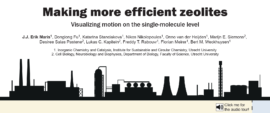
Erik Maris (UU) has won the Poster Award at NCCC for his poster entitled ”Making more efficient zeolites; Visualizing motion on the single-molecule level”. The jury particularly appreciated the infographic-style layout, which allowed easy reading on a computer screen, and embedded sound fragments that made up an audio tour explaining the poster. We spoke with Erik about his poster and the choices that he made in the process of making the poster.
First of all: Many congratulations on winning the NCCC Poster Prize award! What was your poster about?
Thank you! The title of my poster is ‘making more efficient zeolites’, but that’s of course more clickbait than a very informative title. I looked at the motion of single fluorescent molecules when they move through a zeolite. By studying the molecular motion, we try to learn what actually limits this and how we can improve it. When we can improve how molecules move through a zeolite particle, we can also make them more efficient.
What kind of technique did you use?
We used a technique called ‘single molecule localization microscopy’, which makes use of the fluorescent properties of some of the molecules that we study. What we basically do is the following, we come in with a powerful laser that excites the molecules and they emit light of a different colour. This light we collect with a very sensitive camera. Using dedicated algorithms, we can trace back the locations of these individual molecules and construct their travelled paths.
What kind of zeolites were you looking for?
There’re of course many different zeolites. All of these zeolites have a unique pore structure with their own pore shapes and sizes. We decided to go for one of the most widely used zeolites in industry, which is ZSM-5. This zeolite has a very interesting pore structure, because it has both straight pores that run straight through the material and sinusoidal pores that have a zig-zag shape. It was very interesting for us to see how strongly the pore shape affects the motion of the molecules moving through the ZSM-5 zeolite.
What was it like to present your poster digitally at N3C?
I have to admit: It’s very different! Normally, you stand in front of your poster in a hallway where people walk by. So, if you’re not getting much attention, you just start talking to people to lure them in. In a digital environment, that’s not possible. People have to ‘enter’ your room to ask questions.
So what I tried was to make the poster as visually appealing possible, so people would actually start reading and then get dragged into the story.
What did you do with the format of your poster?
I really thought about how a poster would be optimally viewed on a computer screen. Normally, these posters are huge A0 sheets of paper. I thought that’s annoying, because you have multiple columns for which you have to zoom in and move around to read them properly. So, I thought of making it more like an infographic. You probably know them. They’re quite narrow, so they fit in the width of your computer screen and you just keep scrolling down and new text and images appear. That’s what I did for the format of my poster. But instead of an infographic, I put in a scientific story.
The second thing I did was… I included an audio tour. I recorded myself explaining certain sections of the poster, so it also could be viewed as stand-alone. Of course, I’m not standing next to it, and in this way people could still get extra background and hopefully some of my enthusiasm.
Where in our multiscale consortium does you poster fit in?
Of course, the ‘M’ in MCEC stands for ‘multiscale’. We tend to look at different length scales and time scales. To understand how to connect all these length and time scales, it’s very important to understand them on an individual level. I focus on the scale of single catalyst particles and how molecules move through them and reach the active sites.
Thanks Erik, we look forward to your next poster!
